So you’d like to build your own NBA betting model, but don’t know where to start. Don’t worry we’ve got you covered. The first step to building any useful machine learning model is figuring out where you’re going to get your data from. And we’re not talking only about distant past data – what good is it if you have access to last year’s NBA games but not last night’s. The foundation of any sports betting machine learning model starts with access to quality data. In this article, we’re going to walk you through a step by step process that you can use to build your very own personal database of high quality NBA statistics.
Here are some prerequisites for successfully following this article from start to finish:
- Basic knowledge of Python
- Selenium Library
- Jupyter Notebook
Of the three, number 1 is by far the most important. You won’t be able to understand what’s going on in this article if you don’t have a basic knowledge of Python. With regards to number 2, if you don’t already have Selenium installed on your computer, you can follow these instructions to complete that step. And lastly, Jupyter Notebook is what we’ll be using to show our code snippets, but you can just as easily run the code from a .py file, so don’t sweat it if you don’t have Jupyter Notebook.
First, we’re going to get an understanding of the structure of the website we plan on scraping, and then we’ll dig into the code itself. With that being said, let’s get started!
The site we’re going to be scraping is www.nba.com. They provide hundreds of different statistics, some more specific than others. But don’t be overwhelmed, they all follow a similar structure, and if you’re able to scrape one statistic from the site you’ll be able to scrape all of them.
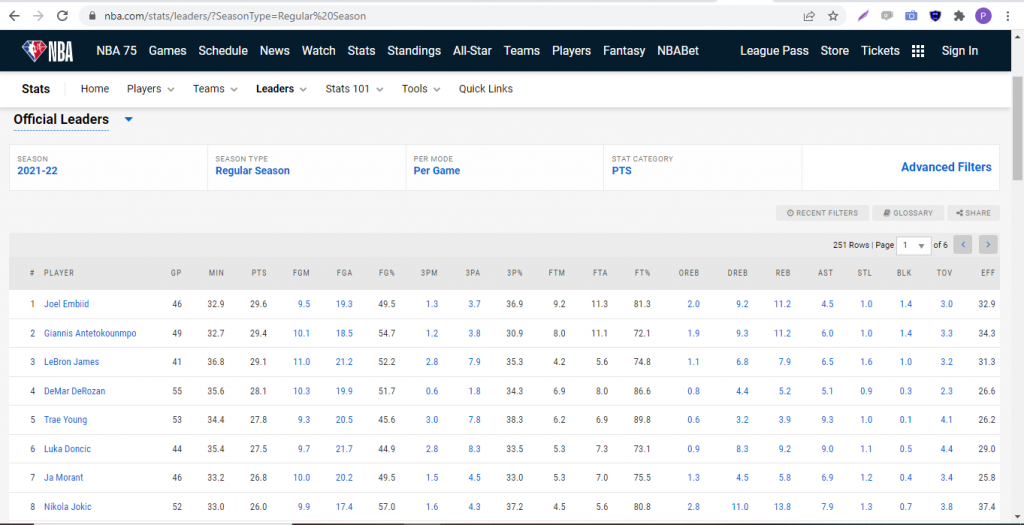
Let’s take a look at the layout of the traditional statistics page.

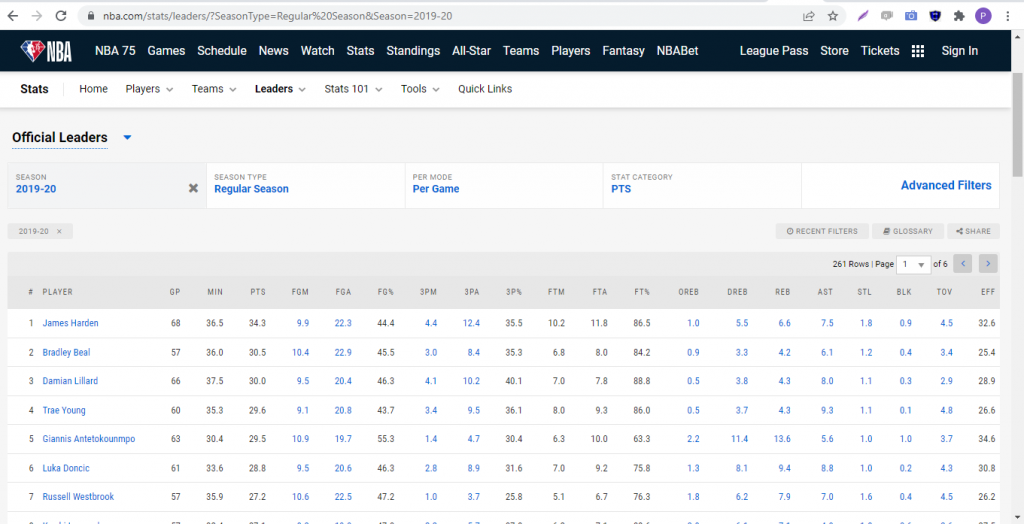
As you can see, there are a few dropdown menus that give you an option to specify which season you’d like to view and the context of how you’d like the particular statistic displayed (per game, per possession, etc). The key thing to notice here is what happens to the URL in your browser when you select an option from one of the dropdowns. Let’s try changing the season to 2019-20 and see what happens.

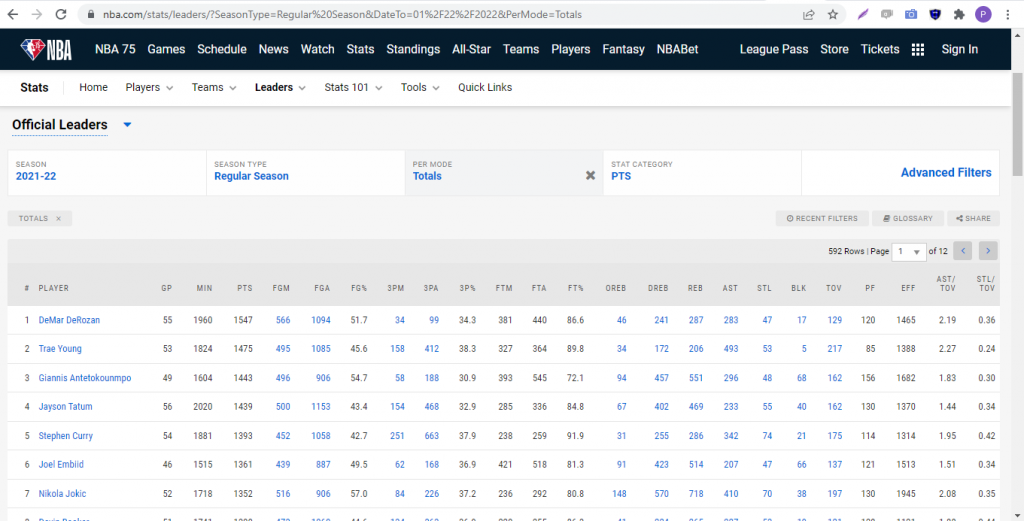
The selected parameters actually appear in the URL itself. This gives us quite a bit of flexibility in how we can access different parts of the website. Now as you can see, the default view for the stats are the players’ per game averages for the season. That’s fine if you’re looking for a static view of their current season averages. But what if you want to get their actual totals on a per game basis? For that, we’re going to need to dig into the Advanced Filters. When you click on the Advanced Filters tab, you’ll see an option for DATE FROM and DATE TO. Let’s manually set both DATE FROM and DATE TO to 01/02/2022. The other minor tweak we need to make is changing the PER MODE dropdown from PER GAME to TOTALS. Hit RUN IT and notice what happens to the url in your browser. The date range shows up as parameters! We can take advantage of this when we’re building our URL strings in our Python code. Your screen should look like the screenshot below:

Believe it or not, we now have everything we need to start coding! Let’s open up a blank Jupyter Notebook and import the packages we’ll need for this scrape. Below is a list of our imports:
import pandas as pd
from selenium import webdriver
from selenium.webdriver.support.ui import Select
import time
from webdriver_manager.chrome import ChromeDriverManager
Just copy and paste that list of imports into your notebook cell and shit SHIFT+ENTER to make sure it runs without throwing any errors.
Next, we need to define our Driver object in Selenium. The driver object is what will automate the opening and closing of your Browser. It’s essentially a Jupyter Notebook controlled Chrome or Firefox browser that you can control programmatically and extract relevant information from.
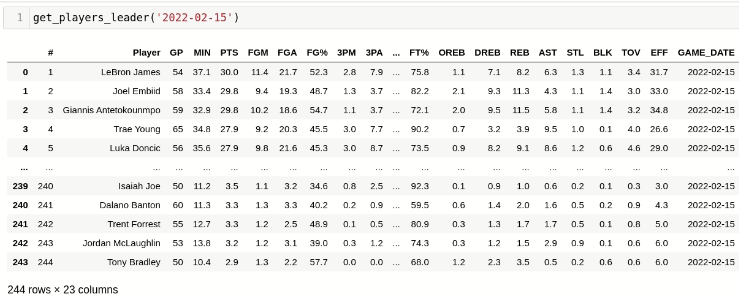
driver = webdriver.Chrome(ChromeDriverManager().install())Finally, we define a function that takes a data in the format YYYY-MM-DD, does all the necessary clicking and filtering and returns a pandas dataframe.
def get_players_leader(game_date):

    year = str(game_date)[:4]
    month = str(game_date)[5:7]
    day = str(game_date)[8:10]

    url = f'https://www.nba.com/stats/leaders/?SeasonType=Regular%20Season&DateTo={month}%2F{day}%2F{year}&DateFrom={month}%2F{day}%2F{year}'

    driver.get(url)

    time.sleep(2)

    #Recognizing cookies in the page and accepting so Selenium can find the table
    cookie_list = driver.find_elements_by_id('onetrust-accept-btn-handler')
    if len(cookie_list)>0:
        cookie_list[0].click()
        time.sleep(2)

    select_list = driver.find_elements_by_xpath('/html/body/main/div/div/div[2]/div/div/nba-stat-table/div[1]/div/div/select')

 #Showing all players available on the filter
    if (len(select_list)>0):
        select_field = Select(select_list[0])
        select_field.select_by_visible_text('All')

    time.sleep(2)

    #Getting and returning dataframe
    stat_df = pd.read_html(driver.page_source)[0]
    stat_df['GAME_DATE'] = game_date

    return stat_df


