In this post, we’re going to dig into some feature engineering. At it’s core, any NBA betting model is a time series analysis problem. You’re trying to predict what a player will do tonight, given what he’s done in the past. The “given what he’s done in the past” is what we call feature engineering. In this post, we’re going to walk you through how to take some basic stats and turn them into season average features, while preventing the dreaded data leakage problem.
First, as always (most of the time), we import pandas. That’s surprisingly the only package we’ll need for this blog post.
import pandas as pdNext, let’s define the features we want to compute season averages for. For simplicity, we chose the basic box score stats.
stats = ['PTS','REB','AST','TOV','3PM','STL','BLK']Now let’s dig into the logic. There are a few relatively straightforward preprocessing steps that need to be performed before computing the season average. But before digging into the code, let’s talk a little about what we DON’T want to do. Imagine the NBA season is 5 games long. Monday, Tuesday, Wednesday, Thursday and Friday. LeBron James scored 20, 25, 30, 35 and 40 points on those 5 days. We pass in all 5 games as part of our training data (the data the algorithm learns from), and the only feature we use is his season average for points. What is his season average? You may quickly think, oh it’s just (20+25+30+35+40)/5 = 30 points. But is his season average really 30 points for all of those 5 game dates? To the algorithm, when it’s predicting Wednesday, the games on Thursday and Friday have not happened yet. So really for Monday, there is no average, because there’s no “yesterday”. For Tuesday, his average is 20 (Monday’s total). For Wednesday, it’s 22.5 (taken by averaging Monday and Tuesday’s outcomes) and so on and so forth.
With that being said, let’s dig into the code. We first need to convert the “GAME_DATE” collumn to a pandas datetime object. Next, we need to sort based on three columns, first by “SEASON_ID”, second by “PLAYER_ID”, and third by “GAME_DATE”. The logic behind this is straightforward: We want each player’s per season stats, sorted in ascending order by game date (to prevent data leakage as mentioned above).
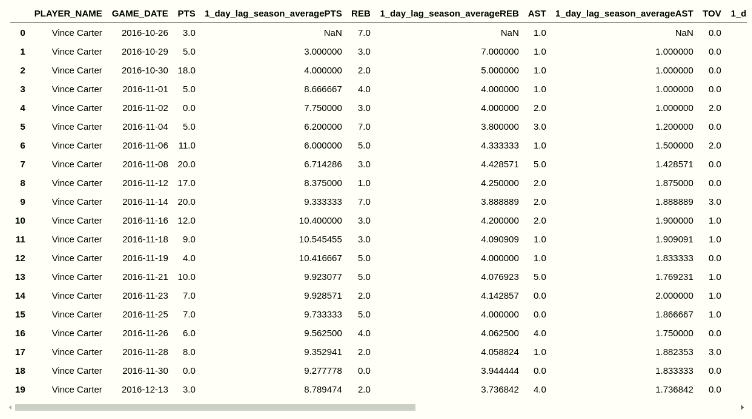
After the sorting is done, we do a groupby on “SEASON_ID”, “PLAYER_ID”, and “TEAM_ID” to ensure that if a player gets traded midseason, we’re counting his stats only with the current team he’s on (as per the game date in the row). We apply a lambda function to the stats columns we defined above, and shift everything by 1 day to make sure that we’re not accidentally counting the player’s stats from that day towards his averages for predicting that day (again a data leakage problem). For each unique SEASON_ID, PLAYER_ID, GAME_DATE group, the first row should be null. That’s because of the shift(1) we performed above.
# full_df is a dataframe with the player stats on each game_date

full_df["GAME_DATE"] = pd.to_datetime(full_df["GAME_DATE"])
full_df.sort_values(by=["SEASON_ID", "PLAYER_ID","GAME_DATE"], inplace=True)
full_df.reset_index(inplace=True,drop=False)

moving_average_dataframe = full_df.groupby(["SEASON_ID", "PLAYER_ID","TEAM_ID"])[stats].apply(lambda x: x.expanding().mean().shift(1)).reset_index(drop=True)
moving_average_dataframe.columns = "1_day_lag_season_average"+moving_average_dataframe.columns
full_df = full_df.join(moving_average_dataframe)

full_df.drop(columns=['index'],inplace=True)