The sports landscape has never been more data-driven, and baseball, with its emphasis on individual matchups, lends itself especially well to this approach. The advent of Sabermetrics has given rise to several novel metrics used to evaluate player performance more comprehensively. One such metric that’s been gaining traction is Expected On-base Percentage or xOBP. A more nuanced take on the traditional on-base percentage (OBP), xOBP employs advanced statistical methodologies to estimate a player’s OBP based on the quality of their at-bats, rather than merely the outcomes. This metric aims to remove some of the ‘luck’ factor from the game and give us a clearer picture of a player’s inherent skills.
Traditional OBP, an already potent measure of a player’s effectiveness, calculates how frequently a batter reaches base via hit, walk, or hit by pitch, ignoring instances when the player reaches base due to defensive errors. While OBP is undoubtedly valuable, it does not account for the quality of contact, ballpark dimensions, or defensive skill level, leading to a potential mismatch between a player’s OBP and their true on-base abilities.
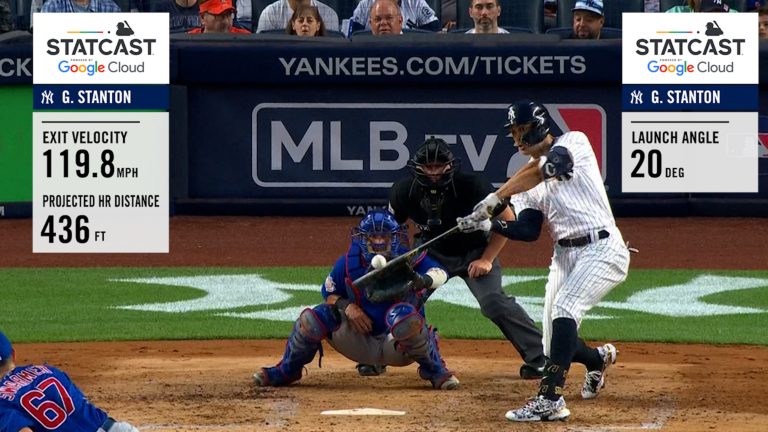
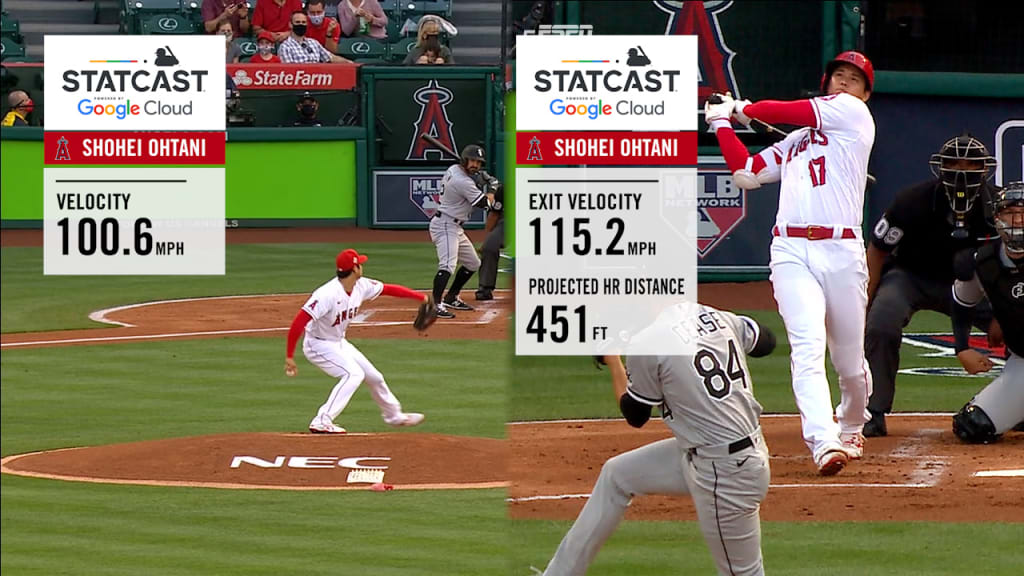
This is where xOBP steps in, bringing a more refined approach to understanding player performance. The underlying principle of xOBP is that not all hits are created equal. Using granular data from Statcast, including exit velocity, launch angle, and sprint speed, xOBP estimates the likelihood of a hit or out based on the quality of contact and the player’s speed. In other words, it paints a clearer picture of how often a player should reach base based on their underlying performance, regardless of the actual outcome of their plate appearances.

Let’s break down the variables that feed into the xOBP calculation.
- Exit Velocity: Exit velocity measures the speed of the baseball as it comes off the bat. A higher exit velocity typically leads to better results, as it gives the defense less time to react.
- Launch Angle: The angle at which the ball leaves the bat, the launch angle, significantly influences the outcome of a batted ball. Optimal launch angles result in line drives and home runs, while extreme angles result in easy groundouts or popouts.
- Sprint Speed: This measures how fast a player can run. The faster the sprint speed, the more likely the player can beat out a throw for an infield hit or stretch a hit into extra bases.
By considering these aspects, xOBP offers a more precise measure of a batter’s potential success at the plate, accounting for the player’s skill in hitting the ball and their speed in reaching the base.
Furthermore, xOBP helps identify outliers whose traditional statistics may be inflated or deflated due to luck or other external factors. For example, a player might have a high OBP due to a string of blooper hits that, due to luck or defensive misplays, landed safely. In contrast, their xOBP would likely be lower, reflecting the quality of their contact. Conversely, a player hitting hard line drives directly at defenders might have a low OBP but a high xOBP, indicating potential for improved results moving forward.
While xOBP offers many benefits, it’s essential to remember that it’s not flawless. Factors like pitcher quality, defensive alignment (like shifts), and ‘clutch’ situations are currently not factored into xOBP calculations, though they do impact a player’s ability to get on base.
Nevertheless, xOBP represents an important step forward in the evolution of baseball analytics. By providing a more accurate estimation of a player’s ability to reach base, xOBP aids teams and analysts in identifying undervalued players, forecasting future performance, and making informed decisions in player